Almost all Calman workflows include one or more RGB Balance charts. These charts are typically used to plot and compare the different amounts of red, green, and blue light produced by a display at different signal drive levels. Because there are options on what information Calman can include in each chart, occasionally there is confusion when comparing different RGB Balance charts plotted from the same display.
RGB Balance Chart
Whenever you perform a Read Series measurement in Calman to measure a display’s grayscale (white balance) performance, one of the primary charts that will typically be used to present the measurement results will be the RGB Balance chart (Shown Below).
This type of measurement might be done either before or after a display calibration is performed, to illustrate and compare the display’s grayscale performance before and/or after calibration is performed.
The RGB Balance chart indicates whether the proper balance of red, green, and blue light is being produced to visually mix together to produce the target color of white (typically D65 white).
The confusion that might occur in viewing or comparing these charts arises because the RGB Balance chart has an option to also show whether the luminance produced at each measured signal drive level meets the luminance target for that particular signal drive level. The luminance target for each signal drive level is determined by the selected EOTF/gamma response.
RGB Balance Chart Reference Options
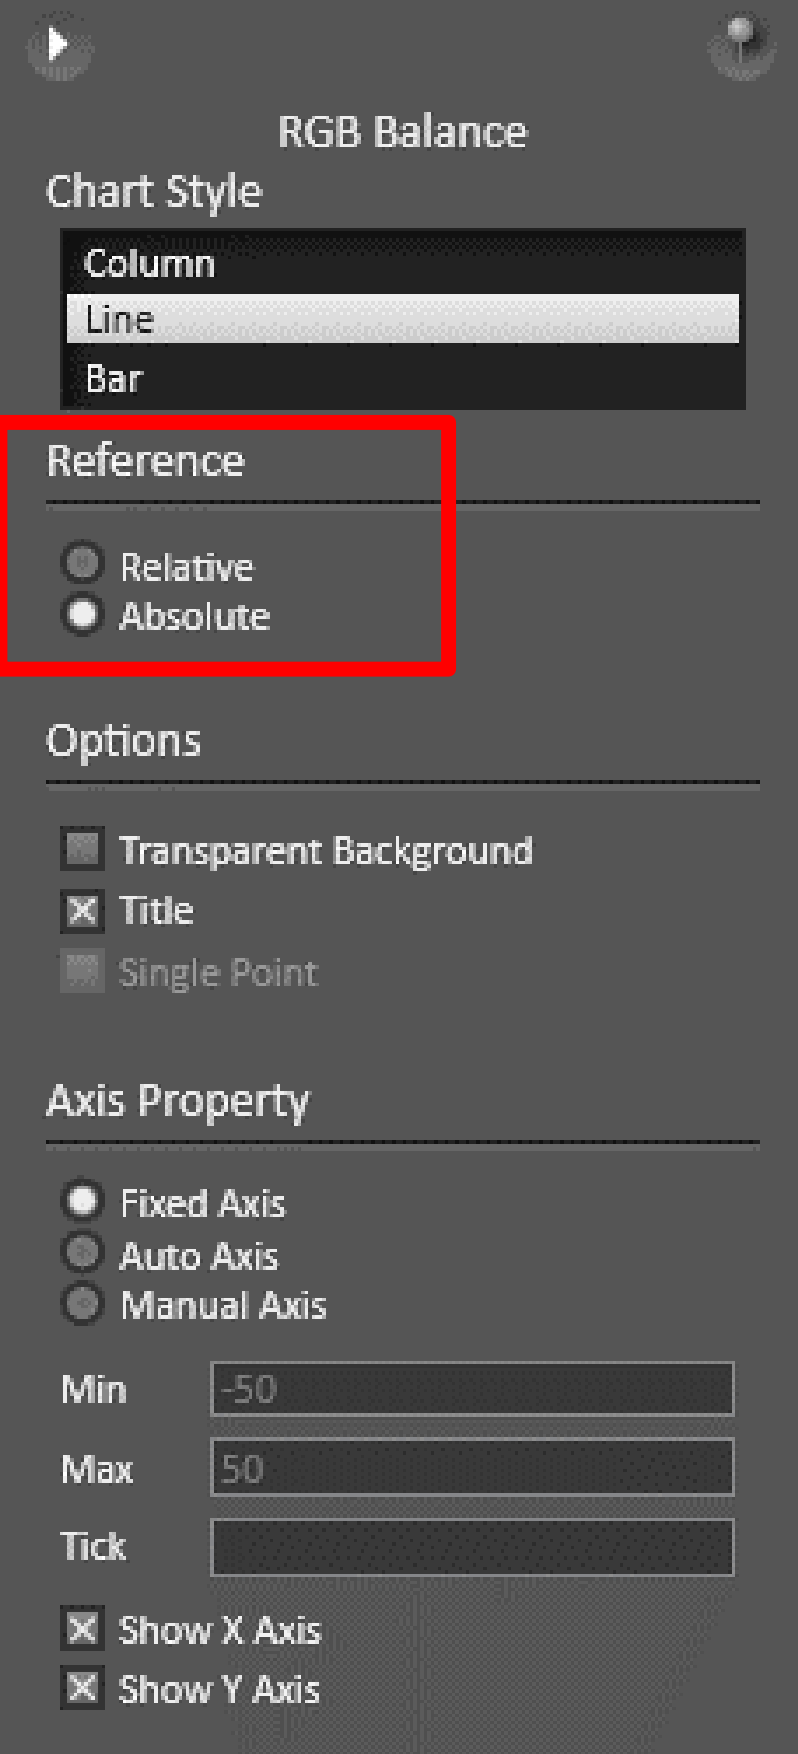
When you right-click on an RGB Balance chart in one of the Calman workflows and select “Properties,” the Properties panel appears on the right side of the Calman screen (shown below). The chart options that we are interested in for this guide are the Relative and Absolute options, in the Reference section.
Relative Reference
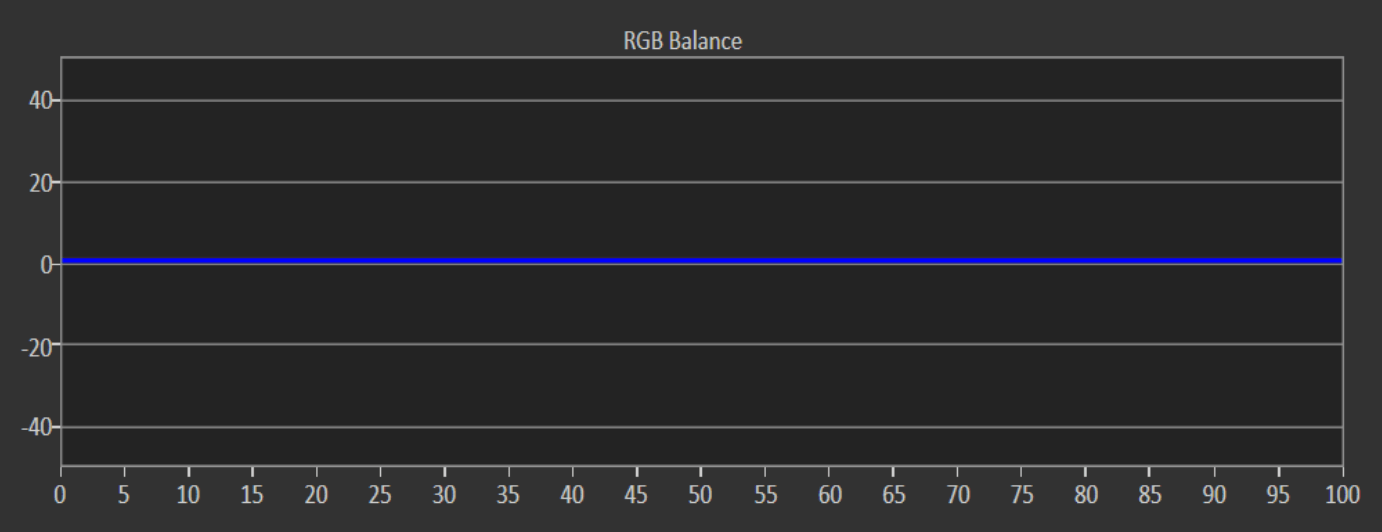
When the Relative Reference option is selected for a Calman RGB Balance chart (either by default or by your selection), the chart shows only the relative amounts of red, green, and blue light that are being produced by the measured display at each signal drive level (shown below). Notice that when the Relative option is selected, the center target line is labeled at 100, with higher levels above and lower levels below. These indicate the relative percentage of colors that the display is producing, compared to what it should produce to visually mix together to produce the target color of white.
A relative reference chart should be used to evaluate RGB balance when adjusting a display’s two-point white balance controls (e.g. RGB cutoff/gain controls). These controls are designed for adjusting a display’s relative color balance at high and low signal drive levels, but not for adjusting the absolute luminance (EOTF/gamma performance) produced at those two drive levels.
It is advantageous to view a relative reference RGB Balance chart while adjusting a display’s two-point white balance controls, to avoid trying to also affect the display’s luminance response. When a display’s two-point controls are used to shift its luminance response, the display’s grayscale linearity is often adversely affected.
Absolute Reference
Along with the relative percentage of colors that a display is producing, compared to the balance required to produce our target color of white, we sometimes also want to know the absolute luminance that the display is producing at each measured drive level, compared to the target luminance level at each of those drive levels.
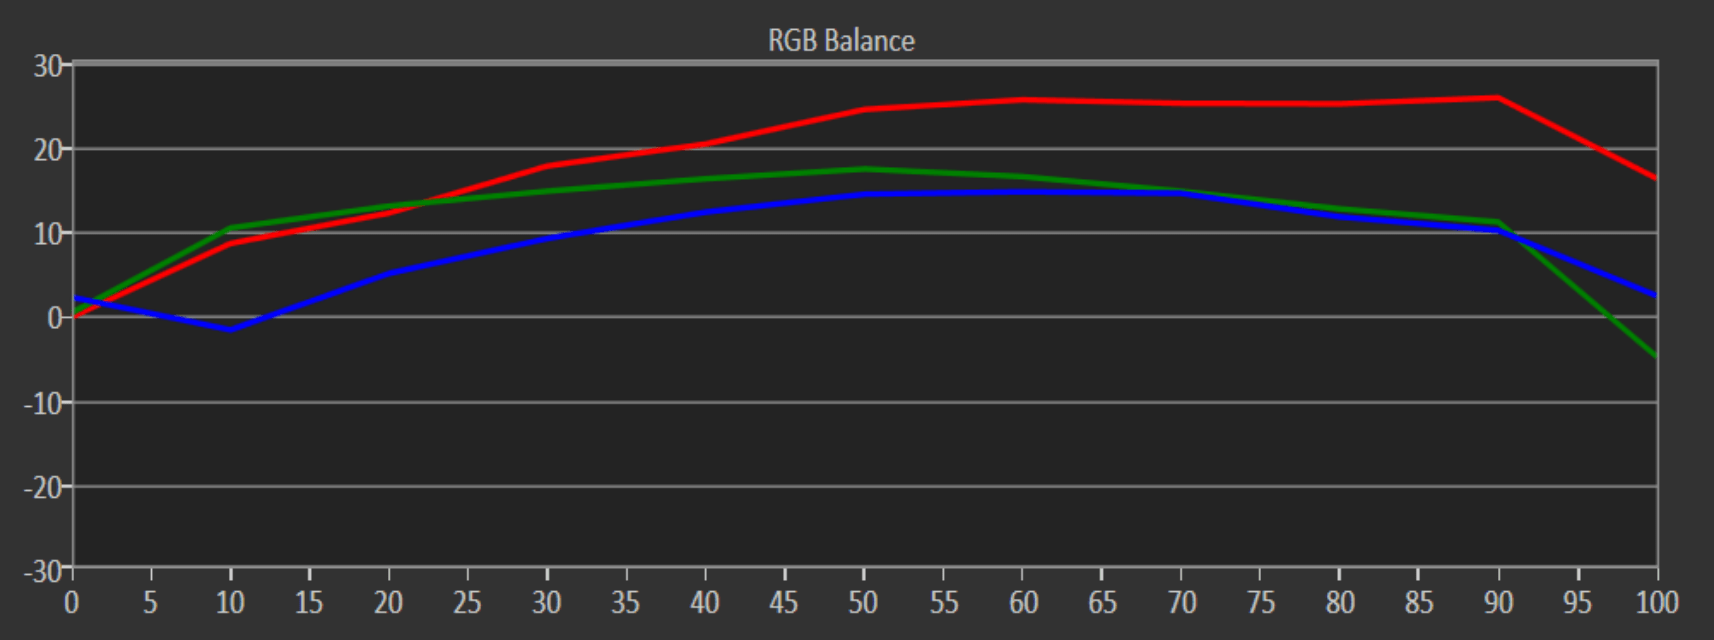
When the Absolute Reference option is selected for an RGB Balance chart (either by default or by your selection), the chart also plots the luminance produced by each color, at each signal drive level, as compared to our target EOTF/gamma response (shown below). The chart below and the chart in the Relative Reference section are from the same measurement data, from an uncalibrated display. Notice that when the Absolute option is selected (below), the center target line is labeled at 0, with high luminance errors plotted above the center line and low luminance errors plotted below the center line.
An absolute reference chart should be used to evaluate RGB balance when adjusting a display’s multi-point grayscale tracking controls (e.g. 10 point or controls). These controls are designed for adjusting a display’s relative color balance and the display’s absolute luminance (EOTF/gamma performance) at multiple signal drive levels. Setting the RGB Balance chart to Absolute Reference allows you to easily adjust each of the colors to its required luminance target at each drive level adjustment point. You simply adjust each color to the 0 center target line. Doing so produces both the target white point balance and the target luminance response.
Comparing Relative and Absolute Reference Charts
Some Calman workflows are configured for adjusting either two-point white balance controls or multi-point grayscale tracking controls, or both, depending upon individual display capabilities. To accommodate these different adjustment scenarios, a workflow may include RGB Balance charts on a number of workflow pages, with some RGB charts defaulted to Relative reference and others defaulted to Absolute. An RGB Balance chart on a 2-pt white balance page will probably be defaulted to Relative reference, while an RGB Balance chart on the post-calibration results page may default to Absolute reference.
A number of workflows have a relative RGB Balance chart on their 2-pt white balance page and an absolute RGB Balance chart on their post-calibration results page. If you use one of these workflows to only calibrate a display’s offset/gain white balance controls, then measure the results on the post-calibration results page, you may be surprised that the RGB Balance charts on those two workflow pages look different.
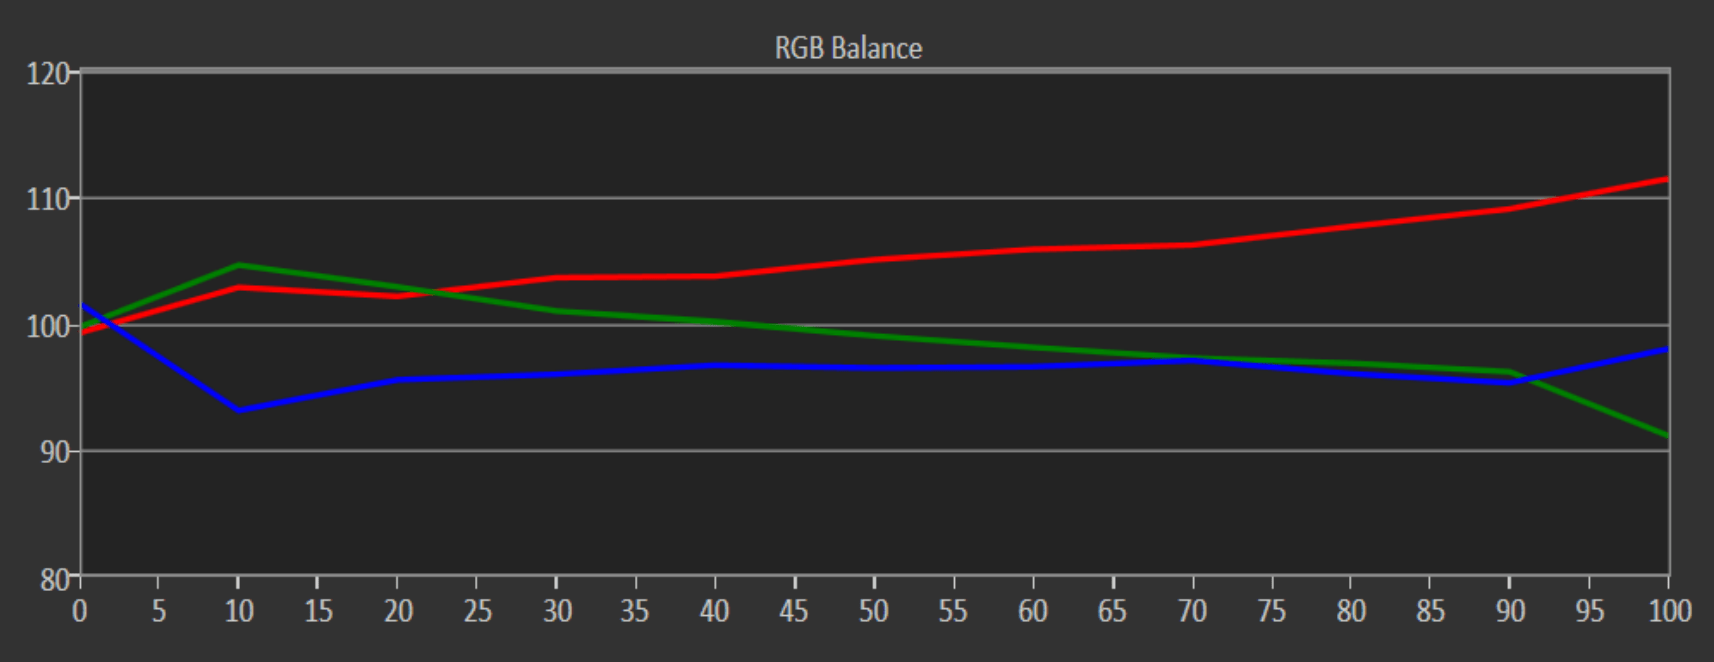
This is illustrated in the two screenshots below. The charts show the performance of the same display, after a very acceptable 2-pt white balance calibration.
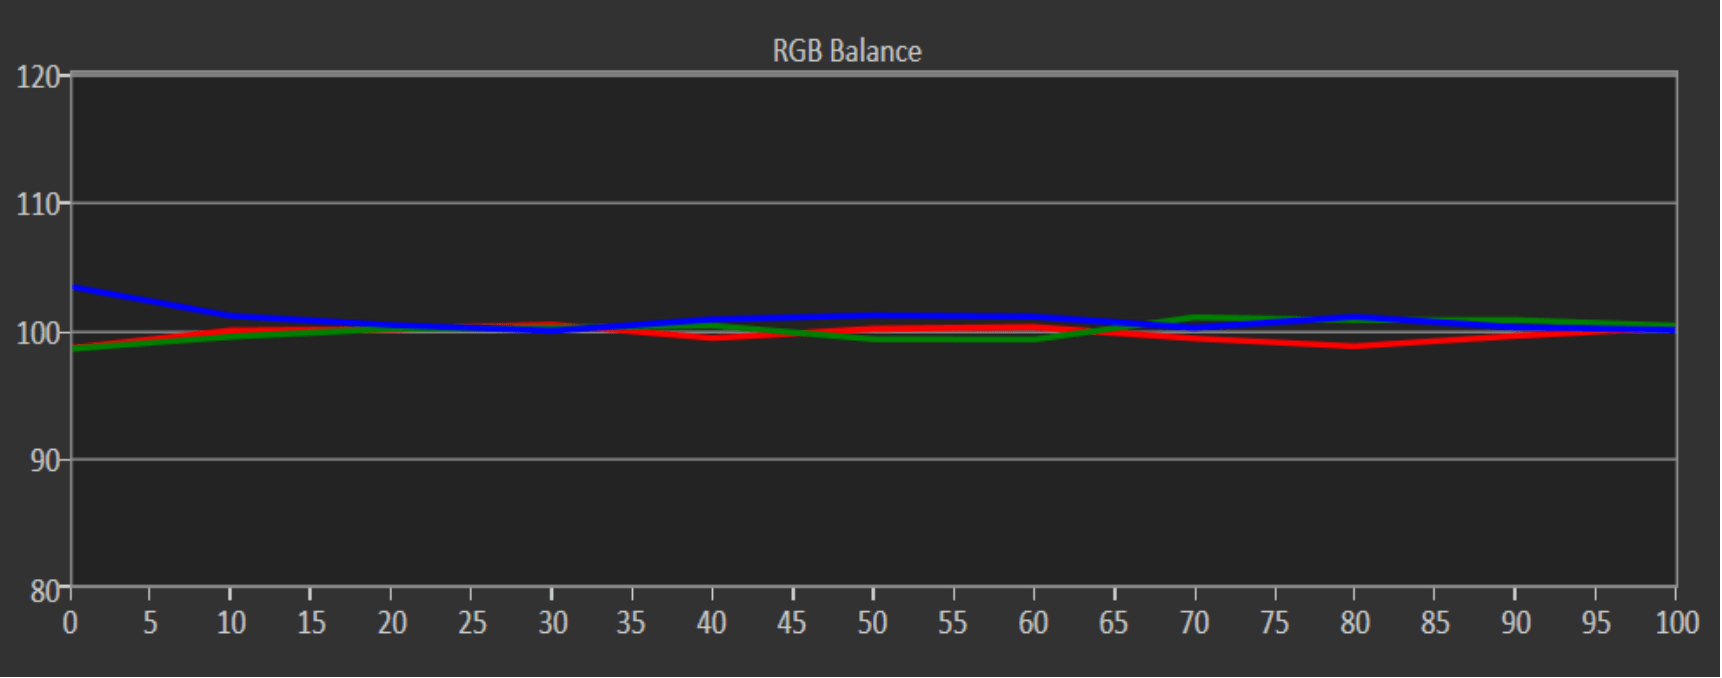
The Relative reference RGB chart in above shows that the display is producing very close to the correct balance of red, green, and blue light at each signal drive level to visually mix together to produce the target color of white.
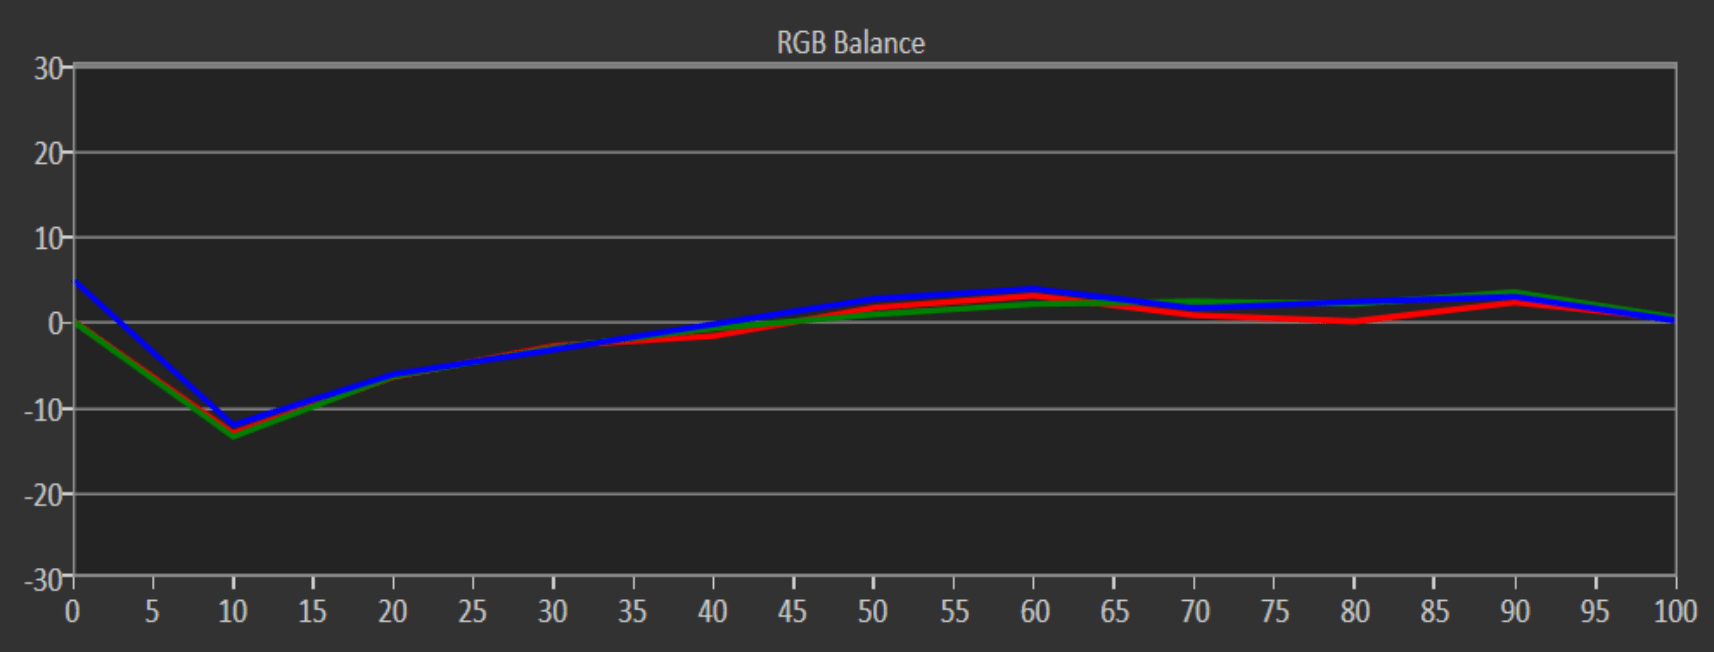
The Absolute reference RGB chart above shows that, while the display is producing the correct balance of red, green, and blue light at each signal drive level, the absolute luminances being produced at each drive level are not all correct, compared to the target luminance levels.
Unless you understand the difference between the relative and absolute references for the two charts, you might be concerned when you see the two charts showing you what appears to be a significantly different performance for the same display.