By Darrell Bird – August 2010
Some people may say that our main goal in calibrating a display is to achieve the best subjective experience possible. But since this experience is different for everyone, our main goal in calibrating should be to force the display into producing images that are exactly what the producers of a given video intended. Luckily, we have standards in place that ensure that major producers of videographic art are all working from the same visual calibration state and therefore, if we can make our displays conform to this state, we can rest easy in knowing that we are seeing exactly what the artist intended.
So let’s start from the beginning. When we walk over and turn on a display, what do we see? Clearly the screen goes from dark to light, or rather, no image to an image. But this change is not instantaneous. In the first 10 seconds we can see an obvious yet gradual change in luminance. If we wait, we can see another slower yet still visible change from 10 to 20 seconds. If we’re in a controlled lighting environment and our eyes are sensitive enough, we can even see a change in luminance from 20 to 30 seconds. So the question is, “How long should we wait to calibrate a screen?”
There are a lot of conflicting ideas about this. Some “professionals” say 15 minutes is long enough. Others say 30. At 100 IRE, I would challenge anyone who says they can “see” a luminance difference after just 5 minutes over any time interval. But I’m not satisfied with my subjective visual assessment of a display and neither should you be. So let’s look at some of the data we’ve collected at SpectraCal.
Not surprisingly, different types of displays show distinctly different luminance properties over time. Let’s start with a standard LCD. Below is a graph of sequential luminance readings taken over a 70 minute span. These are the Y values in foot-lamberts over the time in minutes.
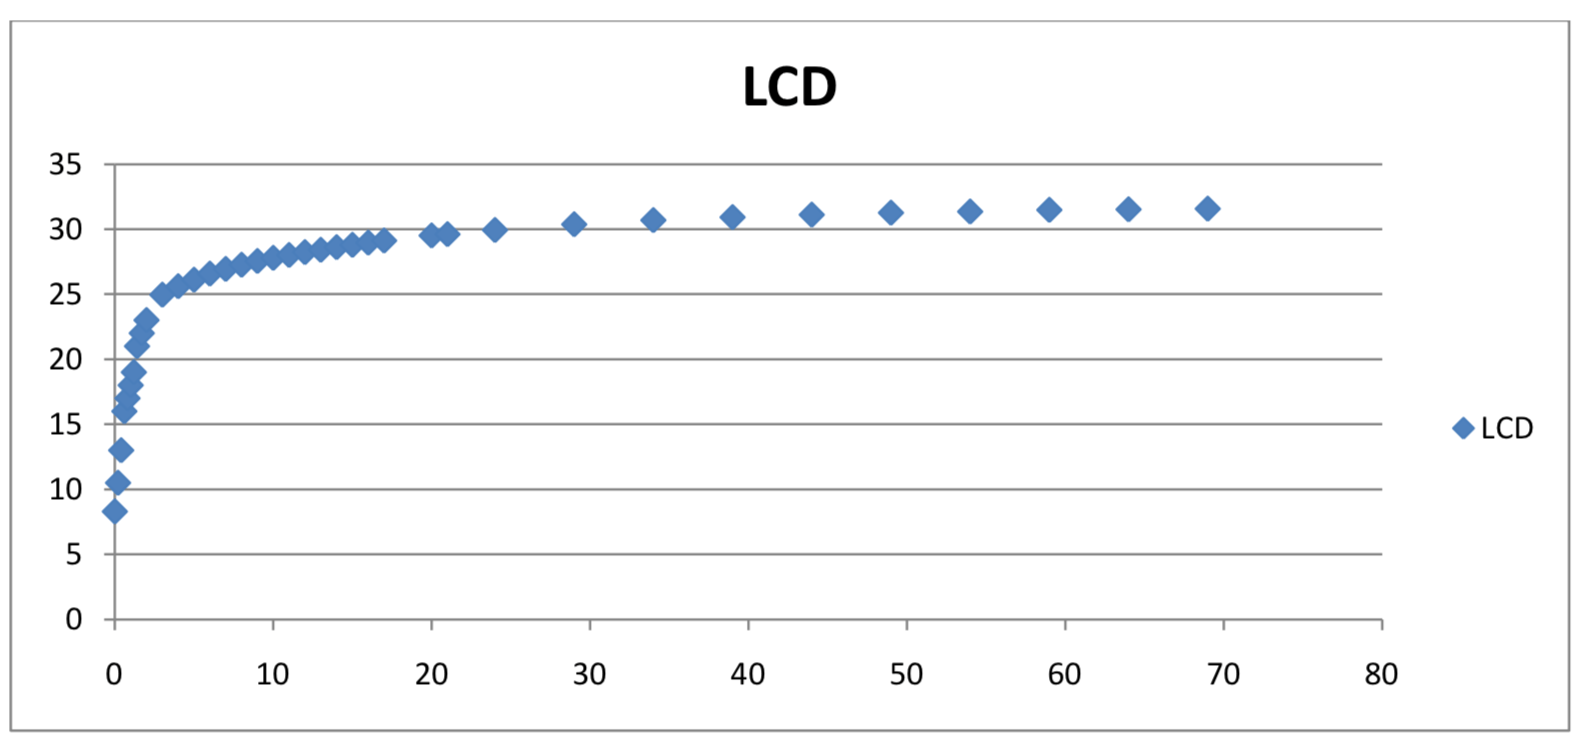
From our everyday experience, this is probably just what you would expect the curve of the luminance change to look like. It is clearly nonlinear but is very intuitively understood. It starts off dim then quickly gets brighter but eventually levels off to an almost constant luminance. That constant luminance is exactly what we want. We don’t want to take a reading, change a setting, and then have to worry about whether a subsequent reading is showing our setting change, increase in luminance due to the screen warming up, or some combination of the two. From the graph we can get an idea of where it is clearly not appropriate to take readings. Obviously the first 10 minutes are out of the question. But to make a real decision about when it’s acceptable to calibrate, we need to look at the actual numbers.
At a given point, the slope of the tangent line to this curve will give us the luminance change per unit time. We want the slope of this line to be as close to zero as possible.
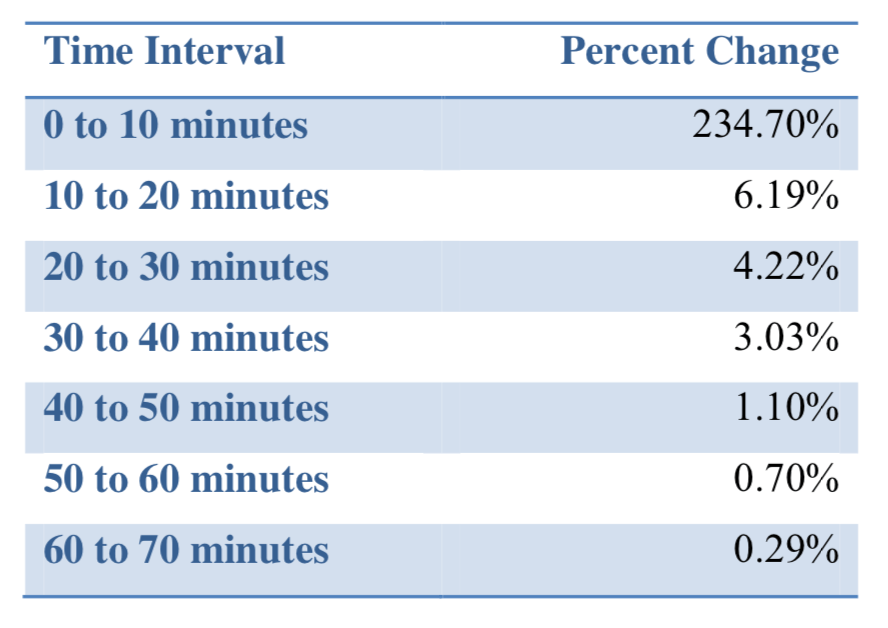
A better way to put it is that we want the percent difference over a given duration to be zero, i.e. no change in luminance. In the first 10 minutes there is a 235 percent luminance change. From 10 to 20 minutes it drops down to a smaller but still significant change of 6.19 percent. At 100 IRE this difference probably cannot be perceived by the human eye. But it is important to remember that our vision’s perception of luminance is logarithmic and is far more sensitive to low level light changes than high ones. So a change of 6 percent in total light output can drastically affect our black levels. We need this change to be much lower. Below is a table of percent changes over 10 minute spans.
At SpectraCal, we will never calibrate a meter until our reference display stabilizes to a change in luminance of less than 0.1 percent per minute. That means that over a 10 minute span, we need to see less than 1 percent of change. On this LCD, that doesn’t occur until somewhere after the 50 minute mark. Of course, if you’re calibrating a client’s display, you may not always have time to wait 50-plus minutes and you’ll have to use your own discretion in determining what change in luminance is acceptable. However, if time is not an issue, I would recommend waiting at least 60 minutes.
Now let’s look at some other display types. Below are two warm up graphs: one for an LED backlit display, and one for a CRT display.
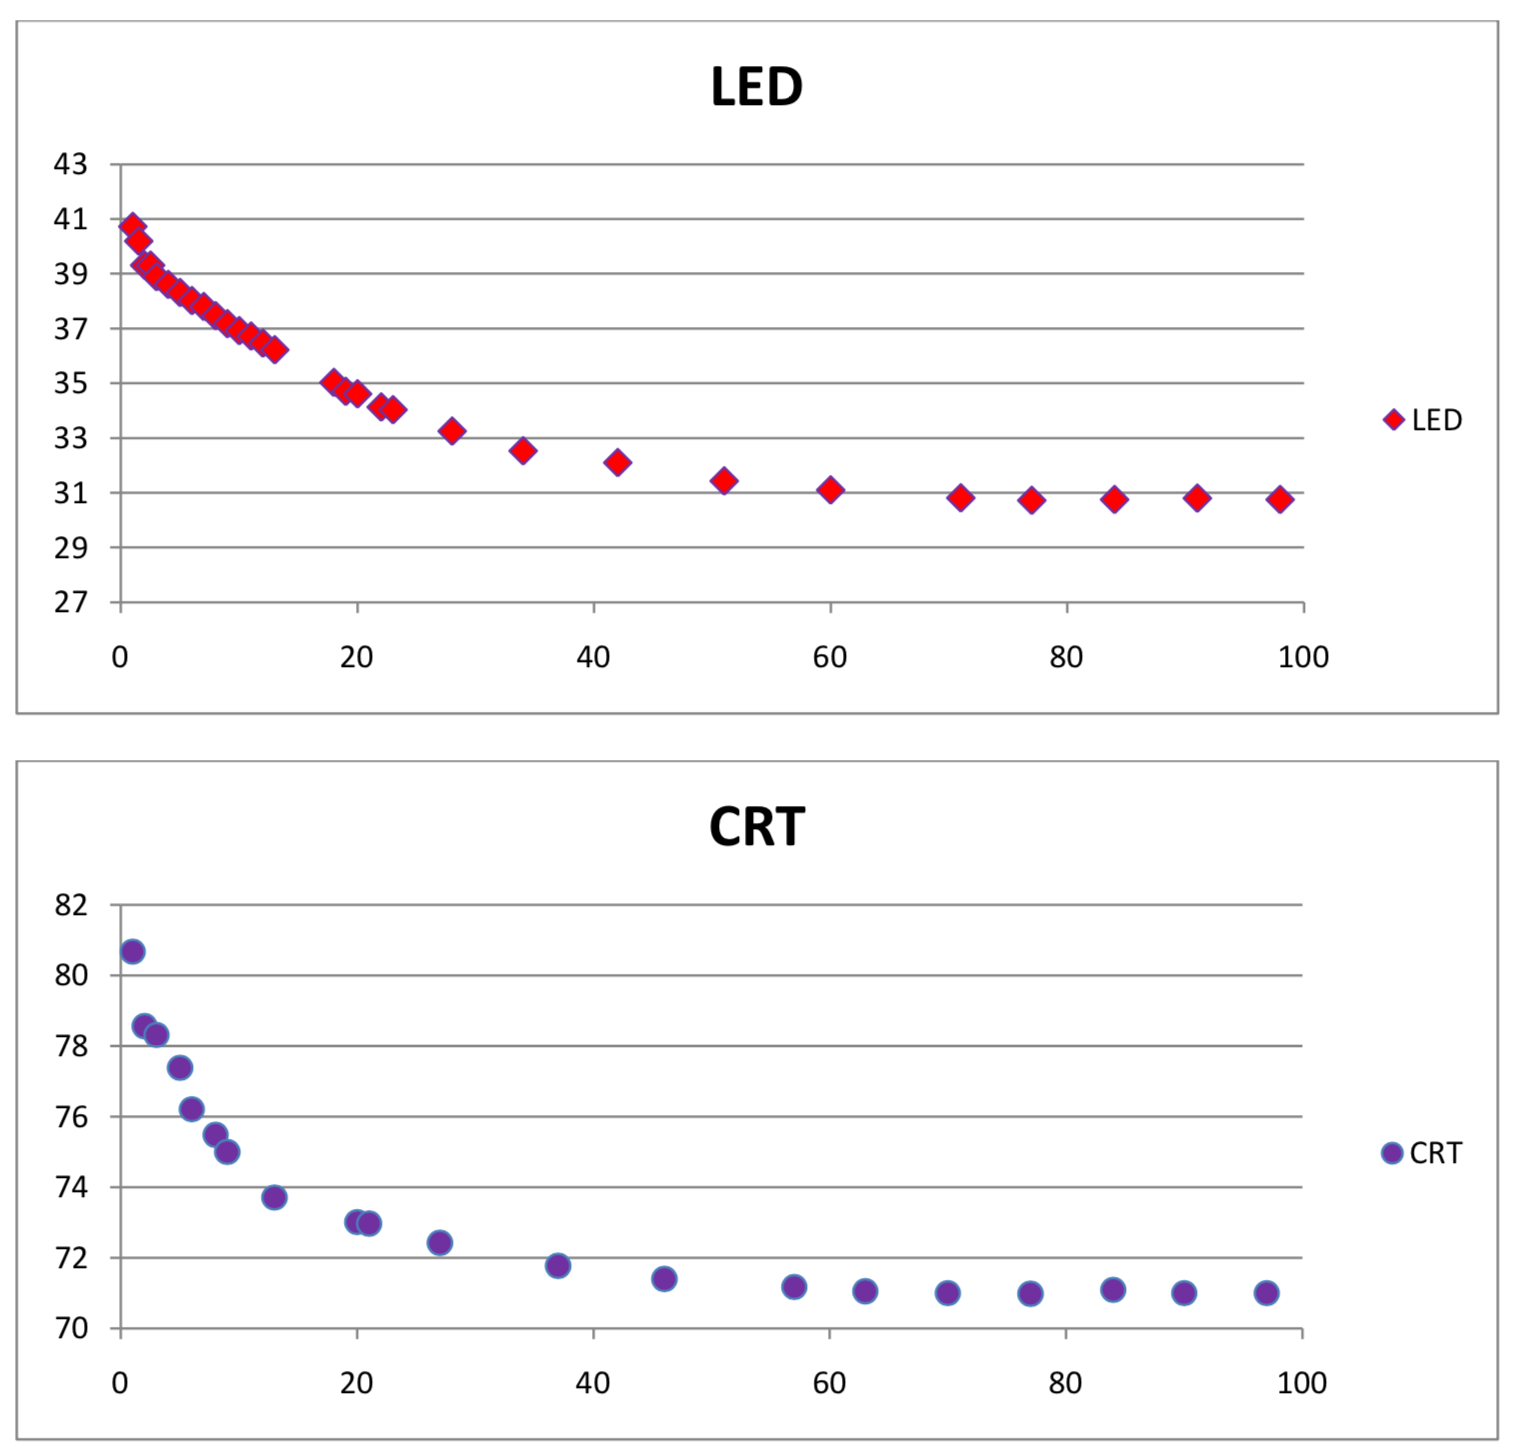
I was extremely surprised to see that as these displays warm up, they actually stabilize to a dimmer state. This means that if we adjusted our black levels too soon, there may be a “crushing” effect after the display stabilizes. These displays stabilize to a luminance change of less than 0.1 percent per minute after 40 minutes for the CRT and after 70 minutes for the LED. However, the shorter warm up rate of the CRT may be misleading if we consider the fact that it stabilizes to a luminance that is more than twice as bright as the LED or previous LCD. This means that if we want the same change in foot-lamberts per minute as an LED or LCD (which would be a luminance change of about 0.05 percent per minute) we would need to wait more than 50 minutes. Of course, make sure to display a moving image to prevent burn in.
Finally, let’s look at an LCD projector.
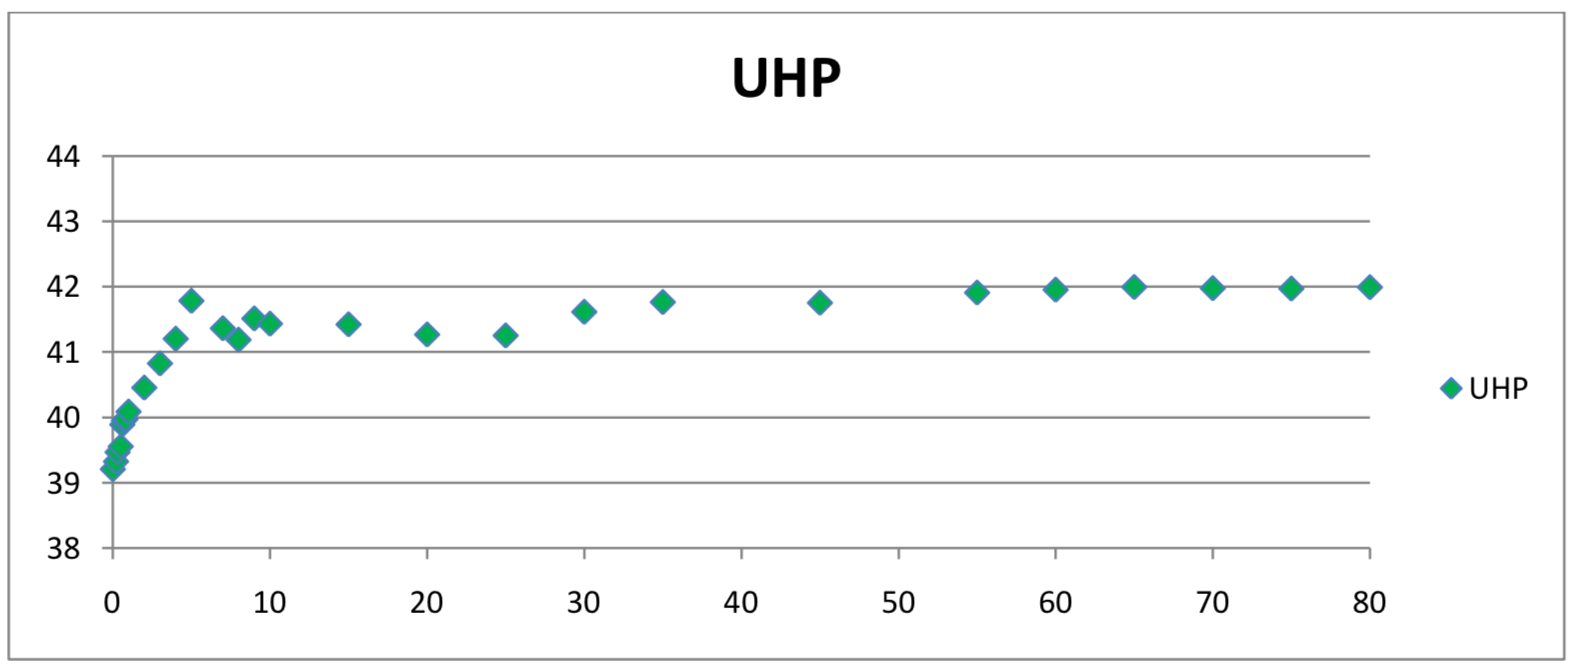
The problem with characterizing the warm up rate of a projector is that despite taking all the steps to ensure a light controlled room, it is still very difficult to remove the intrinsic variability of the projected image. If we trust these numbers then we may be reaching the luminance change of less than 0.1 percent per minute after about 40 minutes. However, at SpectraCal, we still wait 60 minutes before we do any calibrating to ensure that we get to flattest reasonable part of the curve. This graph also reinforces something that we should all already know which is that our light environment is of critical importance when calibrating any display type but none more so than a projection system.